OX Alpha: The harness matters more than you think
A coding agent is two things: a model and a harness, the scaffolding of system prompts, tools, and turn logic wrapped around it. We spend most of our attention comparing models. This experiment holds the model constant and varies only the harness, and in this experiment the harness turned out to be worth almost a 2x difference in score and a 6x difference in token use.
I ran OX Alpha inside nine harnesses: pi, hermes, kimi, opencode, cline, claude (Claude Code), codex, prime, and omp. All harnesses were tested on the same 40 tasks with identical pass/fail checkers.
What this does and does not measure
Before you read the numbers, one clarification:
A model performs well under a harness when the two fit: when the tool formats, system prompt style, and turn structure look like what the model was trained on, and when the harness gives the model the room its problem-solving style needs. That fit is specific to the pair. When claude scores 13/20 on the expert tier here, that is not evidence that Claude Code is a weak harness. With a different model on this same suite, the claude lane scored 59/60. It is evidence that this particular model, under Claude Code’s short-turn discipline, stops before hard problems are finished.
So the right takeaway from this experiment is not “harness X is bad.” The takeaway should be “for this specific model, harnesses X, Y, and Z extract the most.” If we swap the model, we will probably get a different ordering of the harnesses.
Quick background on the setup
The tasks come from a 40-task agentic coding suite I run on a DGX Spark: 20 standard tasks in three difficulty bands (easy, medium, hard) and 20 expert tasks built specifically to be brutal: bytecode VMs, deadlock hunts, crash forensics, spec-trap languages. Every task is scored by a deterministic checker with hidden tests and hash guards, so there is no LLM judging anywhere. A task either passes or it doesn’t.
The model is served through a free gateway, and a logging proxy sits between every harness and the model, recording each API call and its exact token usage. All nine harnesses are measured by the same proxy, not by their own logs. The study ended up at 494 completed runs, 123 million prompt tokens, and 3 million generated tokens, at a total API cost of $0.
Two operational notes. Three harnesses needed adapters to talk to the gateway at all (a protocol translation layer for claude, a Responses-to-chat shim for codex, and a parameter filter for kimi). And the gateway’s free tier rate-limits under load: nine concurrent agents tripped it after about an hour, so every affected run was rerun under pacing. None of the rate-limited runs count in the results.
The scoreboard
Here is the combined result across all 40 tasks.
| Harness | Solved (of 40) | Standard (of 20) | Expert (of 20) |
|---|---|---|---|
| hermes | 37 | 20 | 17 |
| pi | 36 | 20 | 16 |
| kimi | 34 | 17 | 17 |
| claude | 33 | 20 | 13 |
| omp | 30 | 17 | 13 |
| prime | 27 | 16 | 11 |
| opencode | 26 | 14 | 12 |
| codex | 25 | 15 | 10 |
| cline | 21 | 13 | 8 |
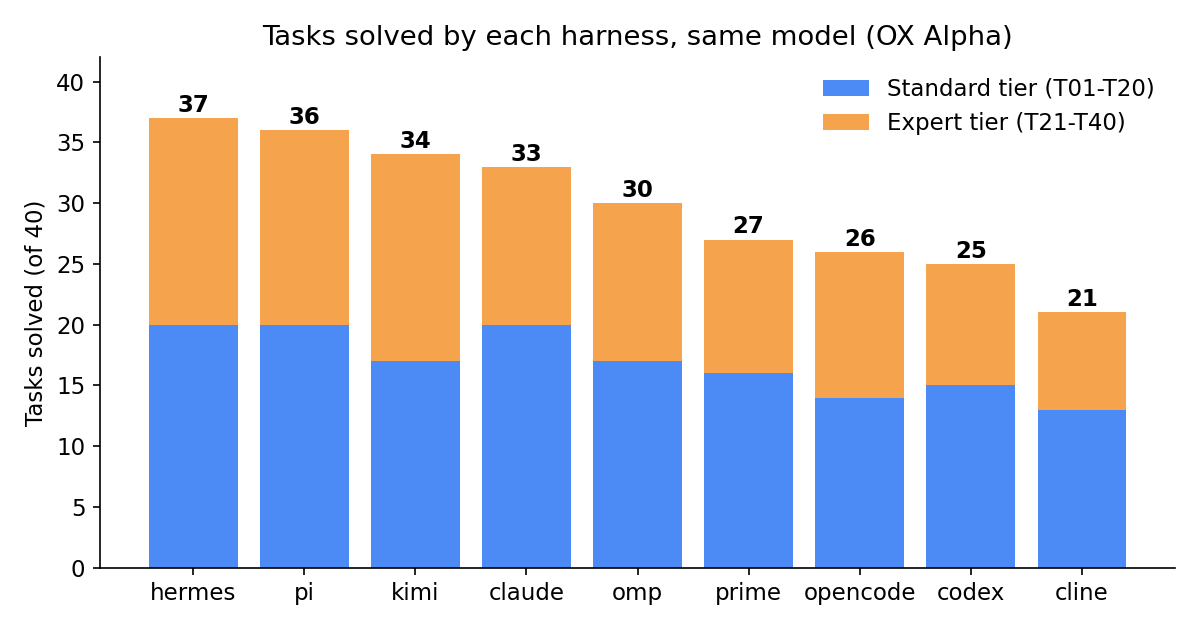
Three harnesses (claude, hermes, and pi) went 20/20 on the standard tier. On those tasks the model was not the bottleneck; almost any competent harness got it there. The expert tier is where the field spread. Claude dropped to 13/20 while hermes held 17 and pi held 16, and the whole table fanned out from 8 to 17.
Expert tasks rewarded grinding: one hermes solve took 98 API calls and 43 minutes of steady tool use. Claude’s median expert run generated about 4,500 tokens and ended cleanly, turn after turn, before the problem was actually cracked.
Score against token use
Here is performance against token use on one chart.
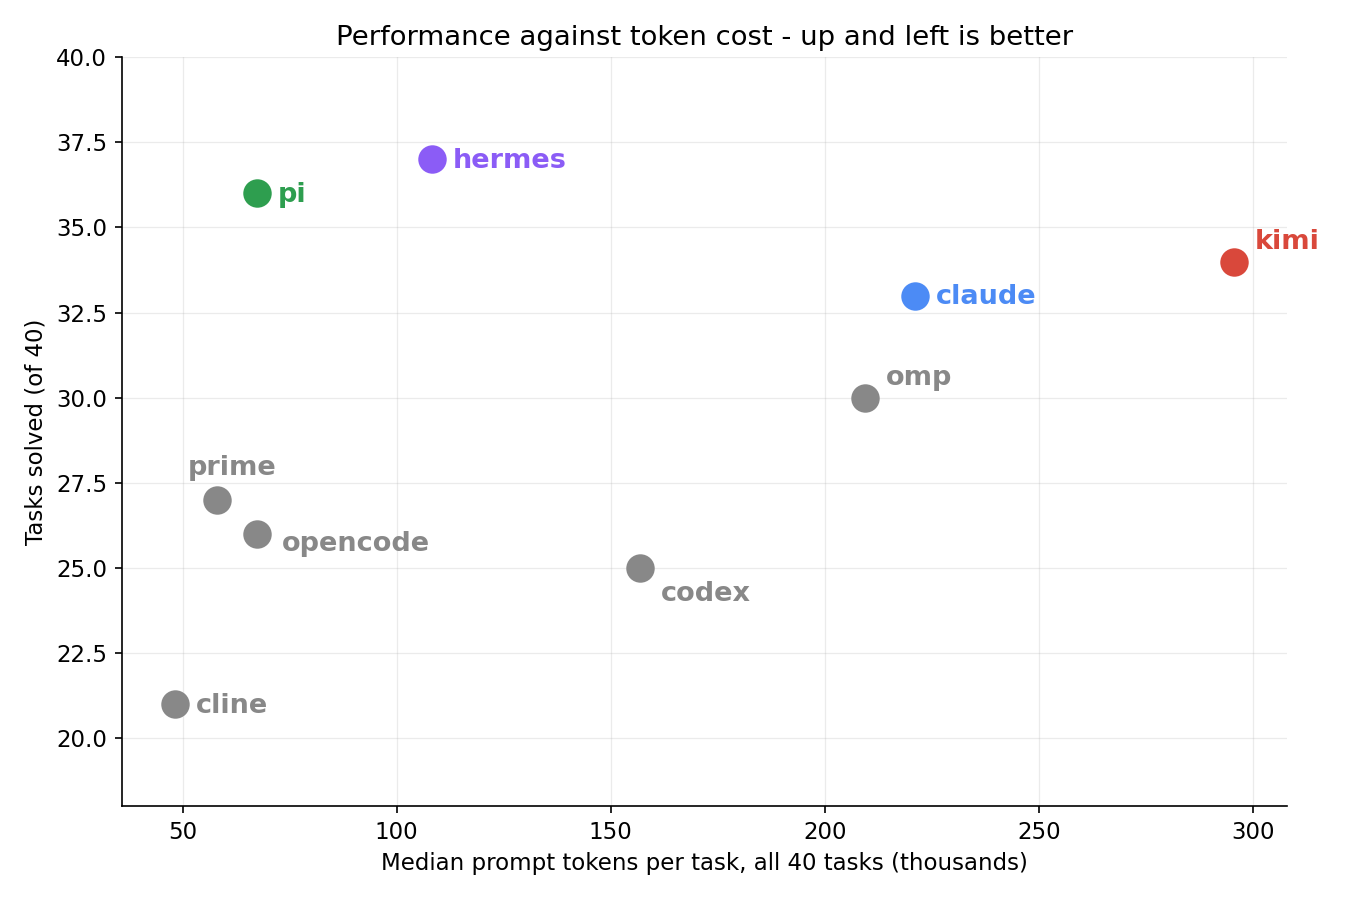
In this experiment, hermes and pi solved the most tasks at the lowest token use (the top-left corner). Kimi reached the same score class as hermes but used almost 3x more tokens than pi to get there. Cline used the least and solved the least. And claude and omp landed in the middle: heavy token use for mid-table scores, again, for this model.
Every harness has a shape
The interesting part is how these tokens are spent, because each harness has a recognizable signature that you can read straight off two numbers: how many calls it made per task, and how much context it carried into each call.
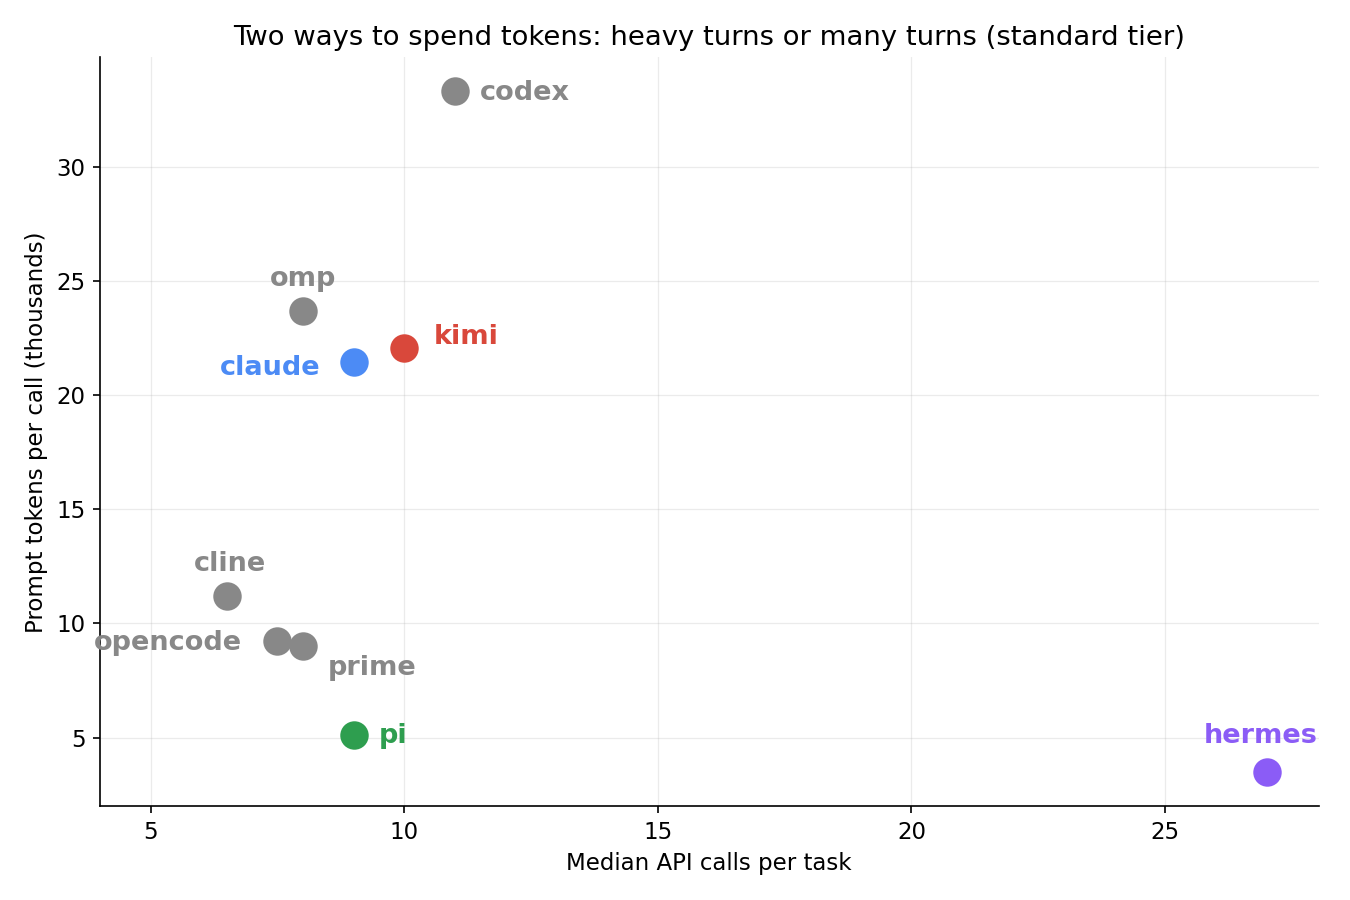
- Pi sent few, small turns. About 8 calls per task, about 4,500 prompt tokens per call. A lean system prompt and lean tool output; nothing travels that doesn’t need to.
- Hermes sent many, tiny turns. The smallest calls in the study, about 3,300 tokens, because it aggressively compresses its own history, but three times as many of them, around 26 per task. Compression plus persistence turned out to be the winning combination on this model.
- Kimi, omp, and claude carried heavy turns. They brought 21K to 24K prompt tokens into every single call: big system prompts and full, uncompressed history. That overhead is fixed: it comes with every call, whether the task is a one-file bug fix or a bytecode VM.
- Codex was heavy and retried. Similar per-call weight, plus a retry habit that re-sent large contexts, which is why its totals ballooned on hard tasks.
- Cline’s runs ended early. Its low expert-tier numbers are not efficiency; under this model its runs stopped after a handful of calls, unfinished.
The generation side had a signature too. Split what the model produced into reasoning (thinking the client discards) and answer tokens, and generation tracked the scoreboard almost perfectly: hermes and kimi, the expert-tier leaders, also generated the most tokens. For this model, generated tokens are close to a direct measure of how much real work the harness extracted.
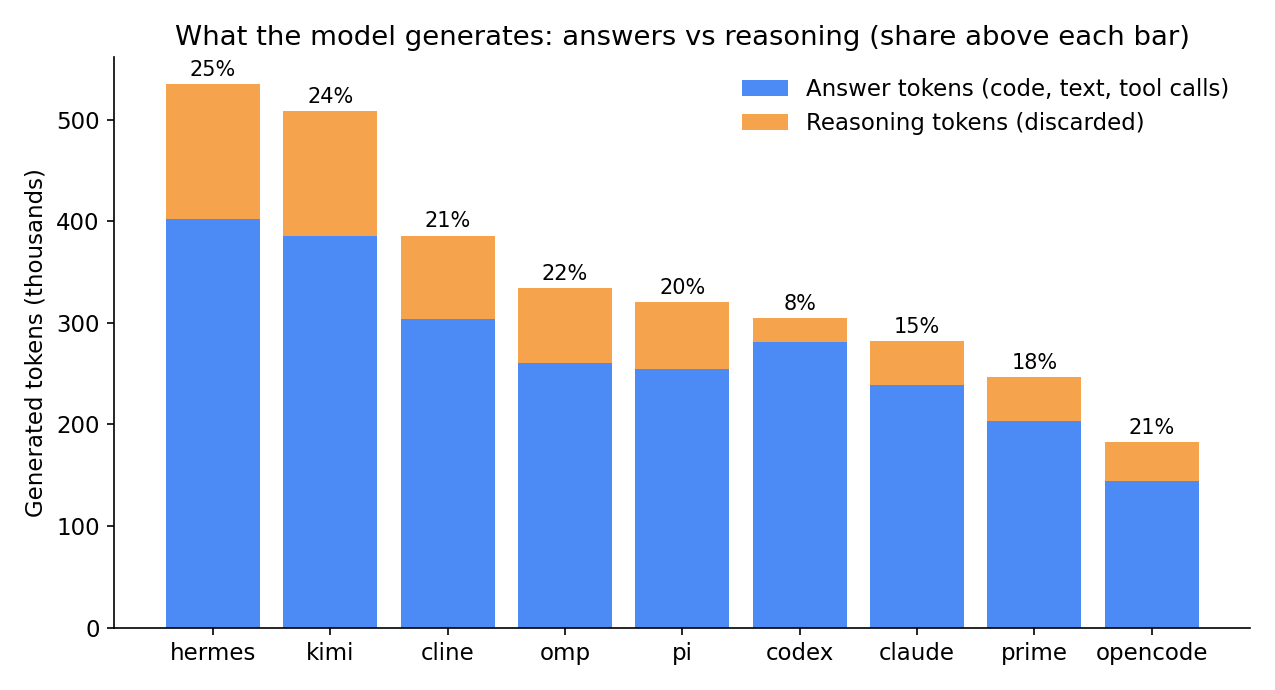
One more observation from this chart: OX Alpha has a reputation for extreme over-thinking, and in single-shot use it deserves it. I have watched it spend 200K characters of reasoning before writing a line of code. Inside an agent loop, that behavior disappeared. Reasoning sat at 15 to 25% of generation for most harnesses, and across 2,619 calls not one hit a length cutoff. With tools in front of it, this model thought briefly and then acted.
Token use is task-dependent
The same harness can use wildly different amounts of tokens depending on what you ask it to do. Here is the median token use per task at each difficulty tier.
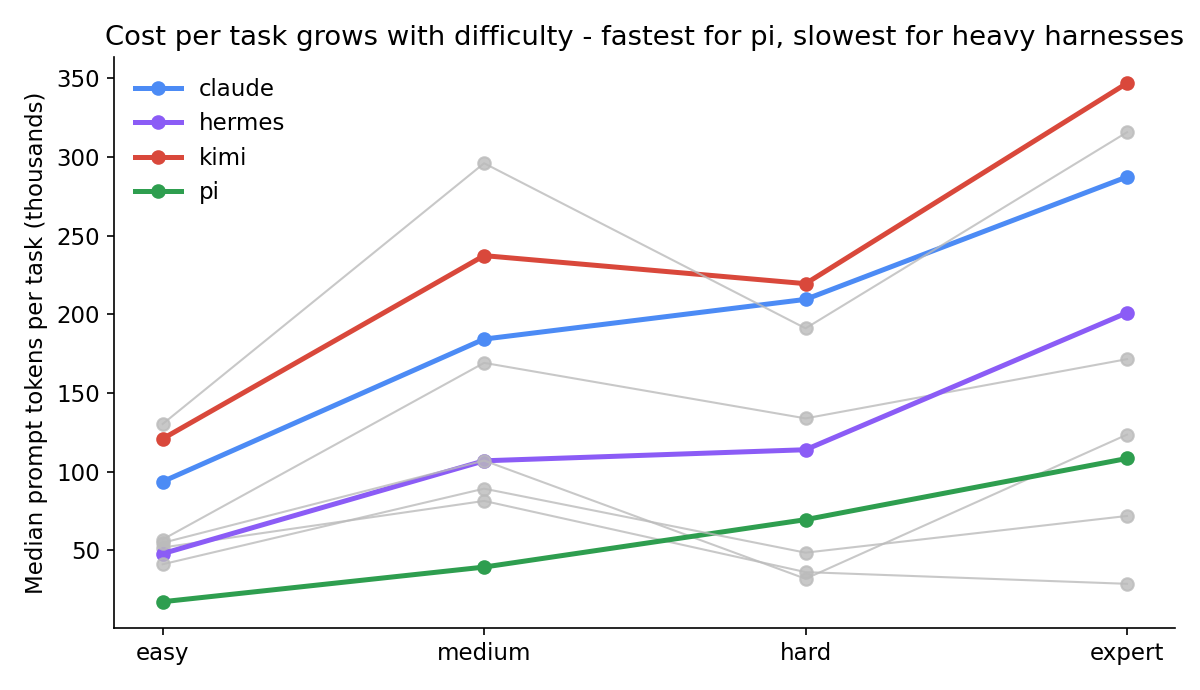
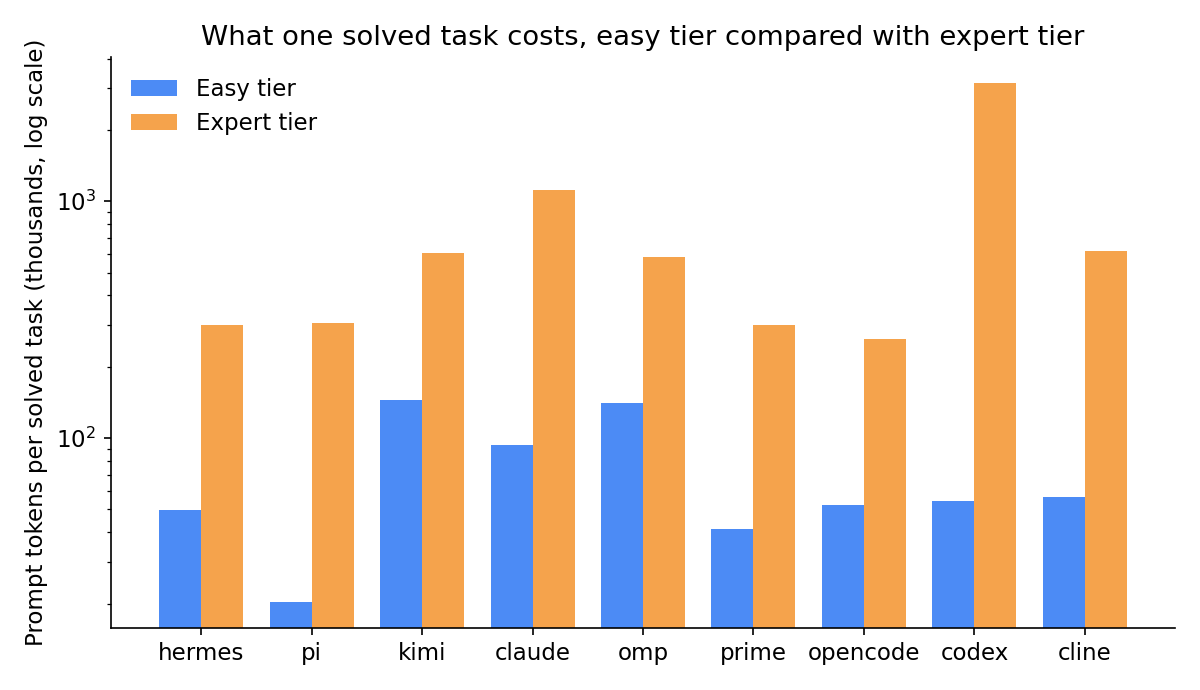
Pi’s line makes the pattern clear. On easy tasks pi used 17K tokens where kimi used 121K, a 7x gap for the same result. But pi’s per-task tokens grew 6.3x from the easy tier to the expert tier, the steepest curve of any harness, while the heavy harnesses only grew 2.4x to 3x. By the expert tier the gap had compressed to about 3x.
My read on why: a heavy harness carries its overhead up front, in the system prompt and the uncompressed history it re-sends every call. On an easy task that fixed overhead is most of the total, so a minimal harness looks hard to beat. A hard task piles up context on its own (more files read, more tool output, more turns), and that growth hits every harness equally, which dilutes the fixed overhead. Minimal harnesses lose their charm on hard work not because they get worse, but because the task starts dominating the token count.
Still, pi used the fewest tokens at every tier and gave up almost nothing in results: 36/40, one task behind the winner.
Where the tokens actually go
A last pattern that matters if you serve models yourself: prompt traffic dwarfed generation. Across the study, harnesses sent between 14 and 150 prompt tokens for every token the model generated, because agent loops re-send the conversation on every call.
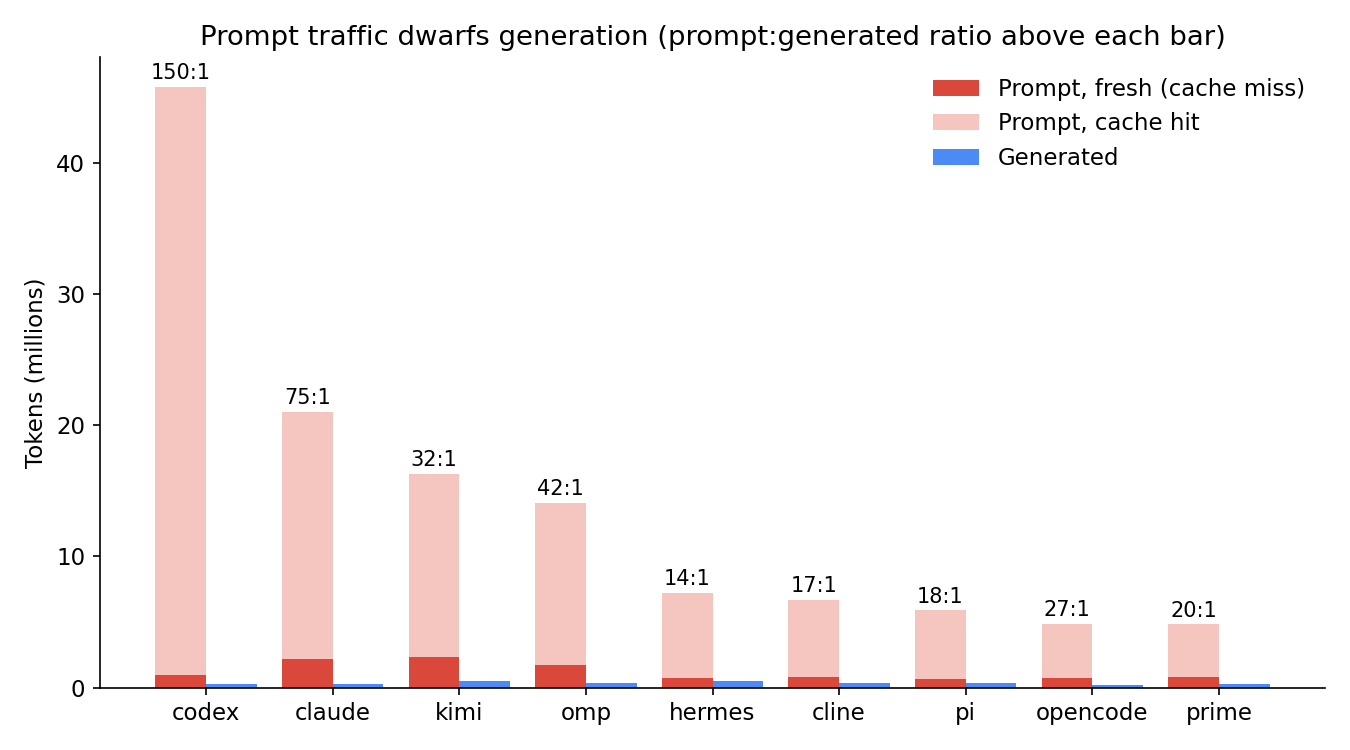
The saving grace is the prefix cache: 85 to 98% of those prompt tokens were cache hits on the gateway, so most of that traffic did not require fresh prefill. That is what makes the heavy harnesses workable at all: claude’s 21K-token context re-send is nearly free work for the server when almost all of it is a cache hit. The model is free right now, so none of this shows up on an invoice. If it gets priced later, this is the part to watch: with discounted cached input, the gap between harnesses shrinks; at full input pricing, the gap is as large as the raw token counts show.
How I read the results
- For this model, match the harness to the work. Routine, well-specified tasks: a minimal harness delivers the same score at a fraction of the tokens. Genuinely hard tasks: pick persistence, because the harnesses that let the model grind solved problems the others left unfinished.
- Don’t read high token use as waste before looking at where it goes. Kimi used the most tokens in the study, and they went into real work: the most generated tokens and a share of the best expert-tier score.
- Benchmark on hard tasks. On the standard tier, three harnesses tied at 20/20 and looked interchangeable. Every insight in this post came from the tier where they separated.
- And the caveat one more time: this is a measurement of model-harness fit. The general lesson is not that any harness is good or bad. It is that the pairing is worth measuring before you commit, because the same model can look mediocre or excellent depending on what you wrap around it.